What is poverty and how do we measure it?
Individuals, families and groups in the population can be said to be in poverty when they lack resources to obtain the type of diet, participate in the activities and have the living conditions and amenities which are customary, or at least widely encouraged and approved, in the societies in which they belong. The standard way to measure poverty uses relative household income. An individual child is said to be living in poverty if they live in a household with income below 60 per cent of the national average (median) income.
Trend in Poverty
Nationally levels of relative poverty have not improved since the Credit Crash in 2008, and projections for the next few years suggest no improvement for people of working-age and pensioners, and an increase in children living in relative poverty. The Covid-19 pandemic and the Cost-of-Living crisis have contributed significantly to this in recent years.
Within Devon there are significant differences across communities in relation to poverty with over 80,000 people living in households dependent on benefits and tax credits. The percentage of persons income deprived varies from 1.6% in Exton to 29.5% in Ilfracombe town centre. The combination of low salaries, high housing and living costs and additional fuel costs for both heating and transportation contribute to poverty in Devon, particularly in low paid working households.
The Picture of Poverty in Devon
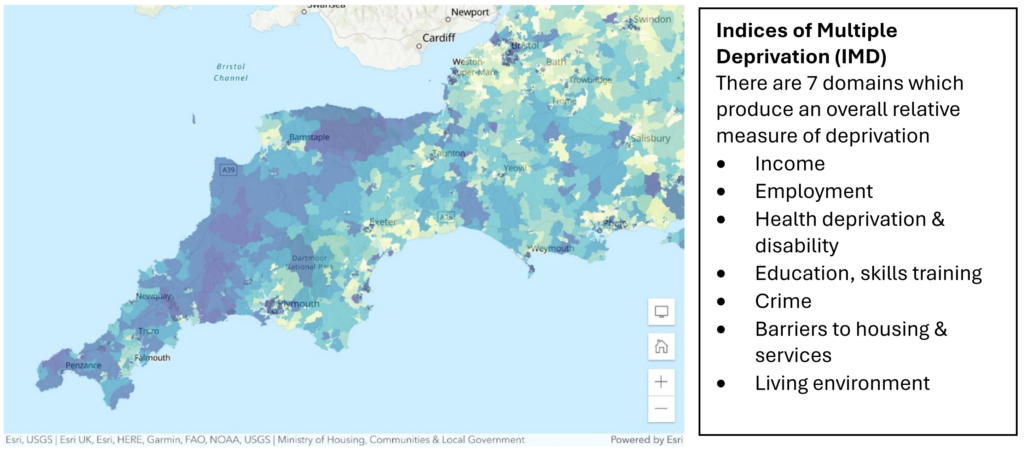
Devon has hotspots of urban deprivation with the highest overall levels in Ilfracombe, with other urban hotspots including Exeter and Barnstaple. Many rural and coastal areas, particularly in North and West Devon also experience higher levels of deprivation, impacted by low wages and a high cost of living.
Index of Multiple Deprivation 2019: Map for the South West

Source: Indices of Deprivation 2019
Research into food and fuel insecurity in Devon was carried out in 2021 and 2022 and it showed substantial increases in food insecurity with 16% of Devon households experiencing very low food security compared with 10% in 2021. Single adults with children, those with lower incomes, the unemployed, the long-term sick or disabled, persons with mental/physical health conditions, where the main respondent was unemployed, and those privately or socially renting housing disproportionately affected highlighting the health inequalities which exist in Devon.
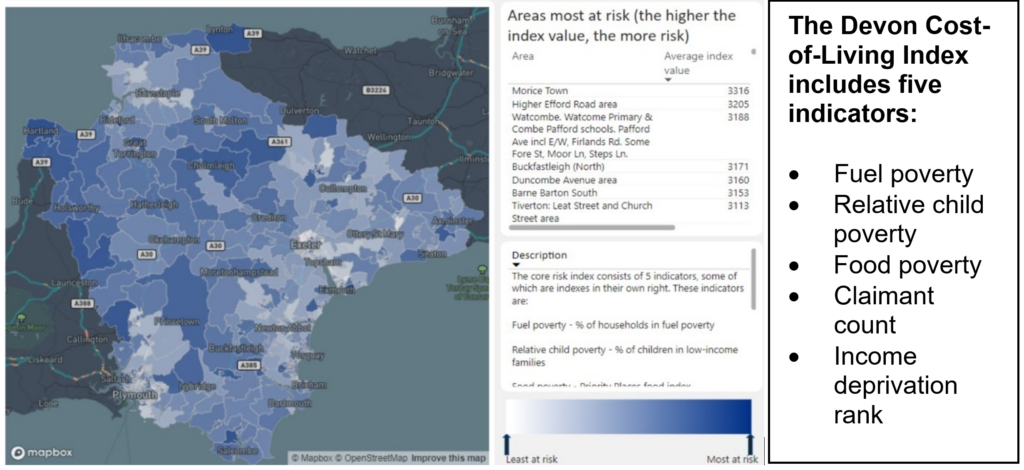
Devon Integrated Care System Cost-of-Living Index, 2023

Source: Devon Public Health Intelligence Team 2023 https://www.devonhealthandwellbeing.org.uk/public-health-dashboards/cost-of-living/
How Poverty, rurality and health inequalities interface
Low income, high cost of living in sparsely populated rural areas, where employment opportunities are limited experience particularly higher levels of disadvantage. Access to services, along with housing quality and affordability, are significant challenges.
Social isolation and loneliness with higher levels of suicide and self-harm admissions, with lower levels of referral to psychological therapies is higher in peripheral rural and coastal communities with high occupational risk groups (e.g. farming and vets). Road traffic accidents highest levels of persons killed or seriously injured are in more deprived rural areas.
How does Devon compare?
18 Lower Super Output areas in Devon are in the most deprived 20% nationally covering a population of 31,100 or 4% of the population. This is influenced by the rural nature of Devon and the fact that urban areas tend to be more deprived. A further analysis for Devon reveals that urban areas in Devon are less deprived than urban areas elsewhere in England (average IMD score 17.5 for Devon vs 23.2 for England), whereas rural areas in Devon are typically more deprived than rural areas elsewhere in England (average IMD score 15.7 for Devon vs 14.6 for England). This highlights particularly challenges relating to rural poverty, particularly in the North and West of the county.
Average full-time salaries in Devon are amongst the lowest in the Country and are the third lowest in the County Council Network (CCN). The median full-time salary in Devon (£31,706) is significantly below the England (£35,100) level. The average house price in Devon is £337,185 which is significantly above the England average (£304,387). Higher than average house prices coupled with lower than average salaries means the house price to full-time salary ratio in Devon is 10.6. Devon has the highest ratio in the South West and comparable to South East levels, and significantly above England average of 8.7.
The Indices of Deprivation (IMD) includes domains, sub-domains and supporting indicators. When you look at the overall index for Devon most sub-domains are less deprived than the national average. However Devon is considerably more deprived, compared to the national profile, for sub-domain measures of indoor environment and barriers to housing/services.
The indoor environment sub-domain covers housing quality and the availability of central heating. 360,300 people in Devon in the Indices of Deprivation, covering 47% of the total Devon population were in the most deprived 20% nationally for this sub-domain. Further to this, most rural areas of Devon fall within the most deprived 20% nationally for indoor environment. All Devon local authority districts are more deprived than the national profile for the Indoor Environment, highlighting local challenges relating to housing quality. The highest levels of deprivation in this domain are seen in the districts of West Devon, Mid Devon and Torridge.
The other key domain within the IMD in which all districts, apart from Exeter and Teignbridge are more deprived than the national profile is for barriers to housing/service. This measures both distance from services such as GPs, food shops, post offices and primary schools, and measures of housing overcrowding, affordability and homelessness. 189,300 people in Devon in the Indices of Deprivation, covering 25% of the total Devon population were in the most deprived 20% nationally for this domain. As you would expect deprivation is highest in more remote districts with a sparse population and more limited access to services such as Torridge, Mid Devon and North Devon.
Summary: Headlines for Devon
- 80,000 people living in households dependent on benefits and tax credits
- Devon has the highest house price to full-time salary ratio in the South West due to the higher than average house prices coupled with lower than average salaries
- 16% of Devon households experiencing very low food security
- Devon falls within the most deprived 20% nationally for indoor environment
- Devon, with the exception of Exeter and Teignbridge, is more deprived than the national profile for barriers to housing/services.
Produced by: Public Health, Devon County Council, August 2024