The Indices of Multiple Deprivation Devon 2025
The purpose of this report is to provide an overview of the Indices of Multiple Deprivation (IMD) in Devon based on the latest release of data published in October 2025. The report summarises Devon’s overall deprivation profile, highlights key patterns across IMD domains and subdomains, and identifies the areas and populations experiencing the greatest levels of disadvantage. It also explores the distinctive features of rural deprivation in Devon, particularly in relation to access to services and the indoor living environment, to support evidence‑based planning and decision‑making across the local system.
What are the Indices of Multiple Deprivation 2025?
The Index of Multiple Deprivation (IMD) 2025 is the latest official measure of relative deprivation across England. It is compiled at a Lower-layer Super Output Area (LSOA) geography, which is the UK’s smallest official statistical classification geography, equating roughly to a large neighbourhood, or small village in terms of population size. It ranks every LSOA based on a composite score against every other area in England derived from seven domains:
• Income
• Employment
• Education, Skills & Training
• Health & Disability
• Crime
• Barriers to Housing & Services
• Living Environment
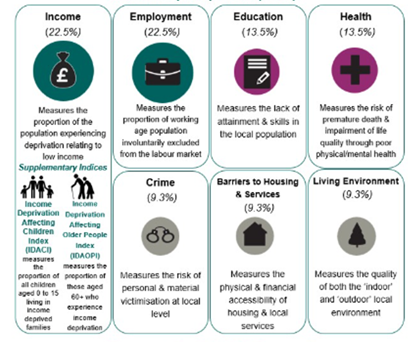
IMD provides a granular view of deprivation, enabling the identification of areas facing the greatest challenges. The 2025 update incorporates 55 indicators (up from 39 in 2019), offering a more comprehensive picture of social and economic disadvantage. While Devon remains relatively less deprived overall, the data highlights persistent pockets of deprivation in coastal towns and rural communities, particularly in relation to housing, access to services, and health outcomes.
The Overall Position
In 2025 Devon remains one of the less deprived counties in England, with the majority of its Lower Super Output Areas (LSOAs) falling into the mid‑ to least‑deprived IMD deciles. This pattern is consistent across most domains, including income, employment, education, health, and crime, where Devon shows relatively low levels of deprivation compared with national averages. Some rural parts of Devon, however, show higher levels of deprivation in some domains, relating to, for example, access to services and sometimes to access to housing, housing stock, or heating.
This countywide picture, however, masks very wide variations and persistent and significant pockets of deprivation, particularly in urban and coastal communities. Notable concentrations of higher deprivation appear in parts of:
• Exeter
• Barnstaple
• Ilfracombe
• Plymouth fringe areas falling within Devon’s LSOA boundaries
These areas experience relatively higher levels of income, employment, and health deprivation compared with the rest of the county.
Nationally, areas within either the most deprived 10%, or 20% of neighbourhoods for the overall measure are classed as deprived.
Visual 1: IMD 2025 by all domains and subdomains
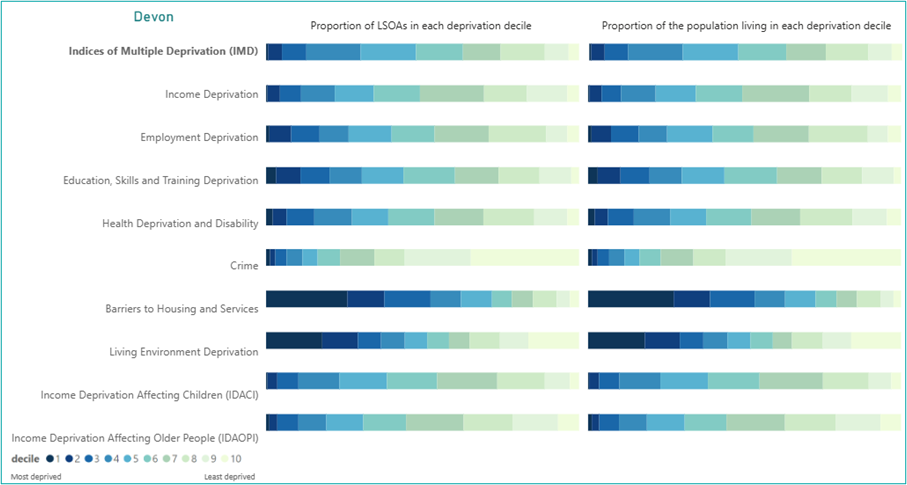
Source: Devon Public Health Deprivation Dashboard – Devon Health and Wellbeing
While overall deprivation is low, rural deprivation continues to be one of Devon’s most defining challenges. This is most evident in the Barriers to Housing and Services domain and indoor living environment, where many Devon LSOAs fall into the most deprived national deciles. This reflects:
- Access to Services
a. Long distances to essential services such as GPs, schools, shops, and employment opportunities.
b. Limited public transport options in many rural areas. - Indoor Living Environment
a. Older rural housing stock, often with poorer energy efficiency, damp, or structural issues.
b. Higher rates of fuel poverty compared with many urban areas.
These rural challenges create hidden deprivation that does not always present through traditional socio‑economic indicators but has a significant impact on health, wellbeing, and inequality.
Small Area Position
Within Devon the following LSOAs are among the overall most deprived 10% of areas in England in 2025:
• Barnstaple Town Centre (more deprived than in 2019)
• Ilfracombe: High Street, Fore Street and Quay (slightly less deprived than in 2019)
• Barnstaple: Forches Avenue Area (more deprived than in 2019)
Additionally, the following Devon LSOAs are within the 20% overall most deprived areas in England:
• Bideford Town Centre (more deprived than in 2019)
• Ilfracombe: College Area (more deprived than in 2019)
• Bideford South East: Churchill Road and Barton Tors area (more deprived than in 2019)
• Exeter: Burnthouse Lane area (Trees) (less deprived than in 2019)
• Exeter: Market Street and Commercial Road (new LSOA)
• Ilfracombe West: Wilder Road and Torrs Park (more deprived than in 2019)
• Barnstaple: Whiddon Drive and Barton Road area (significantly more deprived than in 2019)
• Exeter: Burnthouse Lane area (Rifford Road) (more deprived than in 2019)
• Barnstaple East: Derby and Gorwell Road areas (more deprived than in 2019)
• Exeter: Exwick – Cemetery area (more deprived than in 2019)
• Newton Abbot: Sandringham Road area (more deprived than in 2019)
• Exeter: Lancelot Road area (slightly more deprived than in 2019)
• Tiverton: Queensway and surrounding areas (significantly more deprived than in 2019)
• Teignmouth: Hospital and Mill Lane area (significantly more deprived than in 2019)
• Newton Abbot: Central – Union Road and Halcyon Road area (significantly more deprived than in 2019)
• Barnstaple: St Georges Road area (less deprived than in 2019)
• Tiverton: Leat Street and Church Street area (more deprived than in 2019)
• Teignmouth: Town Centre and Seafront area (less deprived than in 2019)
• Bideford South West: Pynes Lane area (significantly more deprived than in 2019)
• Newton Abbot: Broadlands area (more deprived than in 2019)
• Exmouth: Littleham (more deprived than in 2019)
Changes in the Composite IMD: 2019–2025
Between 2019 and 2025, there has been relatively little overall change in deprivation across Devon, although the general direction of travel shows a small increase in deprivation. This headline change should be interpreted with caution.
Some observed shifts reflect methodological changes in the 2025 IMD, particularly those that better capture aspects of rural deprivation. Other changes are likely to reflect real-world shifts in local circumstances. As a result, increases in deprivation should be interpreted as an indication of change since 2019, rather than in isolation.
In practice, increases in deprivation are most meaningful when both:
• there has been a significant worsening since 2019, and
• the overall 2025 deprivation score is low (i.e. the area is now relatively deprived).
Only where these conditions coincide should changes generally be considered a clear flag for further investigation.
Scale and distribution of change
Out of 444 LSOAs in the Devon County Council area:
• 276 have become more deprived
• 168 have become less deprived
The pattern of change is highly dispersed, with no single, simple geography of improvement or decline. This makes it difficult to draw strong county-wide spatial trends.
Changes in specific communities are likely to be influenced by a combination of factors, including:
• population ageing
• gentrification
• the impact of second homes
• large new housing developments altering local demographics
• wider economic changes
District-level patterns
At district level:
• Exeter has become less deprived overall
• Most other Devon districts have become more deprived overall
• Neighbouring Plymouth and Torbay have both become less deprived overall
These contrasting trends suggest differing demographic, economic, and housing dynamics between urban centres, coastal areas, and rural districts.
Coastal and market town trends
Some notable and contrasting patterns emerge in coastal and market towns:
• A number of traditionally less deprived coastal communities – including Salcombe, Budleigh Salterton, Sidmouth, and particularly Dartmouth – have become more deprived from a previously relatively good position.
• This may reflect the combined impacts of population ageing, high levels of second-home ownership, high housing costs, and limited local employment opportunities.
In contrast, many (though not all) neighbourhoods in more average-ranking but accessible coastal towns such as Seaton, most of Teignmouth, and parts of Exmouth, Ilfracombe, and Bideford, have become less deprived.
This pattern is consistent with a COVID-era ‘flight to the coast’, also observed in nearby parts of Torbay, including Goodrington, Preston and Brixham.
It is important to note that, with the exception of Seaton, not all neighbourhoods within these towns have seen improvement.
Consistent local trends
A small number of towns show uniform change across all neighbourhoods:
• Crediton, Cullompton, Bovey Tracey, South Molton, Great Torrington, Ottery St Mary and Axminster have all become more deprived in every neighbourhood
• Totnes has become less deprived in every neighbourhood
These consistent patterns may warrant particular attention, as they suggest underlying structural or systemic drivers rather than isolated neighbourhood effects.
Income domain (IMD), 2019–2025
Overall, changes in income deprivation across Devon have been relatively small, with a slight overall decrease in income deprivation at county level.
Of the 444 LSOAs in the Devon County Council area:
• 134 have become more income deprived
• 310 have become less income deprived
As with the composite IMD, clear spatial patterns are difficult to identify, with changes in income deprivation generally scattered rather than clustered.
Changes observed in specific communities are likely to be influenced by a range of factors, including population ageing, gentrification, the impact of second homes, large new housing developments altering local demographic profiles, and, in particular, broader economic changes, including shifts towards flexible working and changing commuting patterns.
At district level:
• All Devon districts have, on average, become less income deprived, although some individual neighbourhoods within districts have become more income deprived.
• Neighbouring Plymouth and Torbay have also become less income deprived overall.
At town level:
• No towns have become uniformly more income deprived across all neighbourhoods, although some towns contain individual neighbourhoods where income deprivation has increased.
• A substantial number of towns in Devon contain no neighbourhoods that have become more income deprived.
For more detailed information on data and visualisations, please visit: Deprivation Dashboard – Devon Health and Wellbeing