Inequality is rarely the result of a single factor. Instead, it emerges from the complex interplay between individual characteristics, social and economic conditions, and the environments in which people live. This chapter explores four key dimensions that shape experiences of inequality: protected characteristics, socio-economic deprivation, inclusion health and priority populations, and geography (Figure 1). These dimensions do not operate in isolation; they intersect and compound, creating layered disadvantages for some communities.
By examining these overlapping domains, we can better understand how structural barriers and systemic exclusion manifest across different population groups. This approach supports more targeted, equitable public health interventions and informs strategic decision-making across the wider system.
Figure 1: Dimensions of Inequality
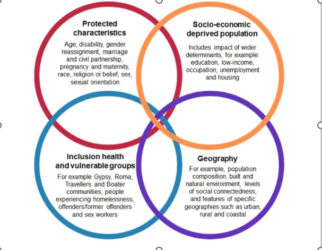
Note: Disability refers to a broad spectrum of conditions that may limit a person’s ability to participate fully in society. This includes physical and sensory impairments, learning disabilities, long-term conditions (LTCs), neurodivergence (such as autism and ADHD), mental illness, and age-related frailty including dementia.
JSNA Headline Dashboard Observations
Life Expectancy
Life expectancy refers to the average number of years a person is expected to live based on current mortality patterns, while healthy life expectancy (HLE) estimates the number of those years likely to be spent in good health. Together, these measures offer insight into not only how long people live, but also the quality of those years.
People with protected characteristics such as disability, ethnicity, sex and sexual orientation often experience significant differences in both life expectancy and healthy life expectancy. These inequalities are shaped by structural barriers, discrimination, and unequal access to the building blocks of health, including housing, education, employment and healthcare.
In Devon, females live longer than males (81.8 years compared to 77.4), but they also experience a greater gap in both life expectancy and healthy life expectancy. The life expectancy gap is 10.7 years for females and 9.5 years for males, indicating that women not only live longer but also spend more years in poor health. Although both sexes report the same healthy life expectancy (64.6 years), the wider gap for females highlights gendered inequalities in later life.
These differences are further compounded by deprivation and geography. People living in the most deprived areas experience significantly worse outcomes than those in the least deprived, with a marked life expectancy gap of 6.3 years. Geographic variation also plays a role, with rural populations living on average two years longer than urban populations. However, this masks the reality of pockets of nested rural deprivation, where small, dispersed communities experience hidden disadvantage within otherwise affluent rural areas.
Differences are even more stark when looking at small areas across Devon, where there can be up to a 15-year difference in life expectancy. These patterns underscore the importance of addressing structural inequalities and ensuring equitable access to the building blocks of health across all communities.
Beyond these broad patterns, certain groups face even more pronounced disparities. Inclusion health and priority populations highlight the deep-rooted inequalities in society. These groups include people experiencing homelessness, substance dependence, imprisonment, systemic barriers linked to migration status and severe mental illness. They often face multiple, overlapping disadvantages that severely impact their health outcomes. For example, individuals experiencing homelessness in the UK have life expectancies that are 30 to 40 years lower than the national average. This reflects the cumulative effects of poor living conditions, limited access to healthcare, and chronic disease burden.
Inclusion health focuses on addressing the needs of socially excluded populations who are underserved by mainstream health and care systems. These groups often experience significant barriers to accessing services, including stigma, discrimination, and lack of continuity in care. As a result, they are more likely to have undiagnosed and untreated conditions, higher rates of communicable diseases, and poorer mental health. Ethnic minority groups and people living in deprived areas also face substantial health inequalities, with gaps in healthy life expectancy reaching up to 20 years between the most and least advantaged communities.
Emerging dimensions of inequality, such as gender identity and neurodiversity, also warrant focused attention. Trans people experience disproportionately high rates of mental health issues, including anxiety, depression, and suicidal ideation. These outcomes are driven by stigma, discrimination, and barriers to accessing gender-affirming care. Estimated wait times for gender clinic appointments vary across the country, with some spanning many years, highlighting a critical gap in service provision. Housing insecurity and lack of inclusive services further compound these challenges. Addressing trans health inequalities requires trauma-informed, inclusive, and affirming service models.
Neurodiversity, including conditions such as autism and ADHD, is increasingly recognised as a dimension of inequality. Although not always classified as a disability, neurodivergent individuals often face exclusion in education, employment, and healthcare systems. Recent local research highlights the significant impact of neurodiversity on health and wellbeing outcomes, particularly in relation to service accessibility and social inclusion. This calls for more inclusive design and support across public services.
Local Insights, Lived Experience and Research: Dimensions of Inequality
Protected Characteristics
Insight questions:
- How do people with protected characteristics experience health inequalities?
- What barriers do they face in accessing services and support?
Sources: NHS Race and Health Observatory, BMJ report on discrimination in primary care, Devon Public Health Outreach
Insight:
Ethnic minority communities report cultural insensitivity and language barriers in health services. People with disabilities face inaccessible environments and digital exclusion. Gendered inequalities are evident in mental health, caregiving roles, and later-life health outcomes. Lived experience highlights the need for inclusive, representative, and trauma-informed services.
Socio-Economic Deprivation
Insight questions:
- How does poverty affect access to the building blocks of health?
- What are the lived experiences of people in deprived urban and rural communities?
Sources: Devon JSNA Overview, Food Insecurity Report 2021–2022, Devon Food Partnership Hub
Insight:
People in low-income households report food and fuel insecurity, poor housing conditions, and limited access to transport and healthcare. Deprivation intersects with other inequalities, compounding disadvantage. Community feedback emphasises the importance of place-based support and addressing the cost of living crisis.
Inclusion Health and Priority Populations
Insight questions:
- What do socially excluded groups say about their health and wellbeing?
- How do stigma and service fragmentation affect outcomes?
Sources: Devon Communities Together, Together Drug and Alcohol Services, Devon JSNA Homelessness Chapter
Insight:
People experiencing homelessness, substance dependence, or involvement in the criminal justice system face extreme exclusion and poor health outcomes. Lived experience reveals mistrust in services, lack of continuity, and the need for flexible, trauma-informed care. Outreach work highlights the importance of relational approaches and co-designed interventions.
Geography
Insight questions:
- How does where people live affect their health and access to services?
- What are the challenges in rural, urban, and coastal communities?
Sources: Devon JSNA Rural Access, Transport Poverty Index, Devon County Council rural transport call
Insight:
Rural and coastal communities in Devon face transport poverty, digital exclusion, and limited-service access. Older adults, people with disabilities and young people are particularly affected. Geographic variation contributes to unequal outcomes, with some small areas showing life expectancy gaps of up to 15 years. Community insights call for localised, mobile, and digitally inclusive services.
Gaps in insights and local research
Intersectionality and Compounding Disadvantage: Limited research on how multiple dimensions of inequality (e.g. ethnicity + disability + geography) interact to deepen disadvantage. Need for more nuanced, intersectional data analysis.
Lived Experience and Community Voice: Underrepresentation of lived experience across all groups, especially those with protected characteristics and priority populations. Lack of systematic approaches to capturing and integrating community insights into service design.
Granular and Localised Data: Insufficient small-area data on health outcomes, transport poverty, housing quality, and digital exclusion. Need for hyper-local mapping to identify and respond to inequalities more precisely.
Service Access and Continuity: Limited understanding of how fragmented services affect priority populations. Gaps in evidence around trust, engagement, and continuity of care for socially excluded populations.
Evaluation of Interventions: Few evaluations of co-designed, trauma-informed, or mobile service models. Lack of evidence on what works in rural, coastal, and digitally excluded communities.
Dimensions of Inequality Priorities for Devon
1. Strengthen Local Research Capacity
- Develop community-led research opportunities to gather lived experience across all dimensions.
- Undertake intersectional data analysis to understand overlapping inequalities.
2. Improve Data Collection and Sharing
- Update and expand datasets on food insecurity, housing conditions, and transport poverty.
- Use GIS mapping to visualise health inequalities at the neighbourhood level.
3. Strengthen Intersectional Data Analysis
- Linking datasets across protected characteristics, socio-economic status and geography
- Using models such as Multilevel Analysis of Individual Heterogeneity and Discriminatory Accuracy (MAIHDA) to explore compounded disadvantage
- Embed intersectionality in dashboards, reporting and equity impact assessments
- Develop intelligence to identify pockets of nested rural deprivation
4. Advance Inclusive Practice
- Embed inclusive training and audits to tackle systemic bias, improve cultural competence, and ensure policies reflect the needs of priority populations
- Co-design services with underrepresented communities including trans, neurodivergent, and inclusion health populations, to create trauma informed, affirming and accessible pathways
- Ensure accessibility across physical, digital, and transport infrastructure, and transport infrastructure, and use community-led evaluation to monitor and improve inclusive practice system wide
5. Community Empowerment
- Embed a Community Engagement Framework outlining different participator methods to ensure community voice comes through
- Highlight VCSE leadership in co-design and service delivery
6. Embed Co-Design and Trauma-Informed Approaches
- Support VCSE partners to lead co-designed service pilots with priority populations.
- Train public sector staff in trauma-informed practice and inclusive engagement.
7. Enhance Service Accessibility
- Expand mobile health and care services in rural and coastal areas.
- Invest in digitally inclusive infrastructure, including community hubs and digital literacy programmes.
- Embed systemic rural proofing processes across services.
8. Monitor and Evaluate Interventions
- Embed accountability mechanisms within governance structures across the system, ensuring that all organisations contribute to monitoring, learning and improvement.
- Integrate inequality observatory functions into existing system-wide governance and intelligence structures, ensuring shared ownership across public sector organisations, VCSE partners and community-led initiatives.
- Use participatory evaluation methods to ensure community voices shape service improvements.
For more information, please visit the following: –
(NEW) JSNA Headline Report – Devon Health and Wellbeing
Public Health Dashboards – Devon Health and Wellbeing
Health and Wellbeing Library – Devon Health and Wellbeing
What trans and non-binary people told us about GP care | Healthwatch
Building Blocks of Health
The “building blocks of health” refer to the essential conditions and resources that enable people and communities to achieve and maintain good health. Building blocks are the practical interpretation of the wider determinants of health. For inclusion health and priority populations, these building blocks are often compromised or inaccessible, contributing to poorer health outcomes and reduced life expectancy.
Table 1 describes how the building blocks apply across all groups within the dimension of inequality
| Dimensions | Group | Challenges Across Building Blocks of Health |
|
Protected Characteristics
|
Age | Older adults: mobility, isolation, ageism; Younger people: economic insecurity, mental health risks. |
| Disability | Inaccessible housing, transport, and healthcare; employment discrimination; limited social inclusion. | |
| Sex and Gender | Gender pay gaps, unequal caregiving burdens, gender-based violence, and health service bias. | |
| Race and Ethnicity | Discrimination in housing and employment; poorer access to culturally competent healthcare; environmental hazards. | |
| Sexual Orientation | Stigma, mental health risks, unsafe housing, and lack of inclusive services. | |
| Gender Identity | Stigma, mental health risks, unsafe housing, and lack of inclusive services. Recent Healthwatch England evidence highlights systemic barriers in GP care for trans and non-binary people, including misgendering and limited access to gender-affirming care. | |
| Religion or Belief | Cultural insensitivity in services; discrimination in employment and education. | |
| Pregnancy & Maternity | Employment insecurity, housing instability, unequal access to maternal healthcare. | |
| Marriage & Civil Partnership | May influence access to benefits, housing, and social support systems | |
| Socio-Economic Deprivation | Low-income households | Poor housing, food insecurity, limited healthcare access, transport poverty. |
| Unemployed individuals | Economic exclusion, mental health risks, reduced access to services. | |
| Low educational attainment | Lower health literacy, employment barriers, reduced engagement with health systems. | |
| Poor housing conditions | Damp, overcrowding, instability contributing to poor physical and mental health. | |
| Occupational risk | Manual or precarious jobs linked to injury, stress, and poor long-term health outcomes. | |
| Homeless individuals | Lack of shelter, hygiene, nutrition, and healthcare; extreme exclusion. | |
| Gypsy, Roma, Traveller & Boater communities | Poor access to education, healthcare, and stable housing; discrimination. | |
| Offenders/former offenders | Barriers to employment, housing, and healthcare; stigma and isolation. | |
| Sex workers | Safety risks, legal vulnerability, limited access to non-judgmental services. | |
| Substance dependence | Housing instability, criminalisation, poor physical and mental health, fragmented care. | |
| Migrants & asylum seekers | Language barriers, legal restrictions, trauma, limited access to services. | |
| Severe mental illness | Discrimination, unemployment, poor housing, under-treatment of physical health. | |
| Geography | Rural populations | Transport poverty, limited–service access, digital exclusion, social isolation, older less efficient housing stock and pockets of nested rural deprivation. |
| Urban populations | Overcrowding, pollution, crime exposure, housing affordability issues. | |
| Coastal communities | Economic decline, seasonal employment, poor transport links, service gaps. | |
| Low social connectedness areas | Isolation, reduced resilience, weaker community support networks. | |
| Poor built/natural environments | Environmental hazards, lack of green space, poor infrastructure. |